
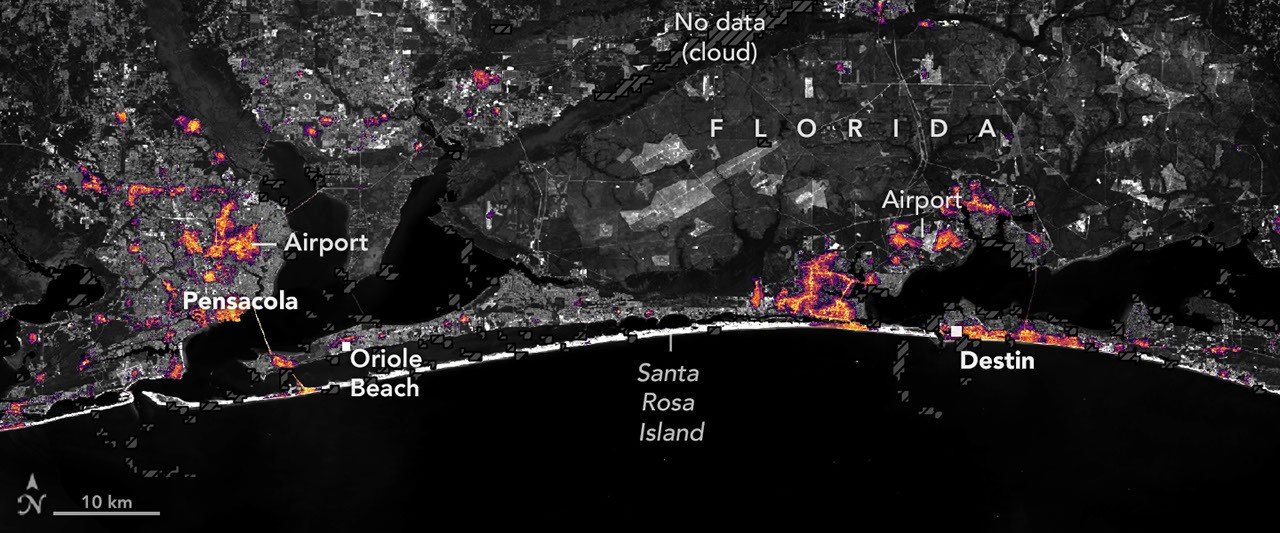
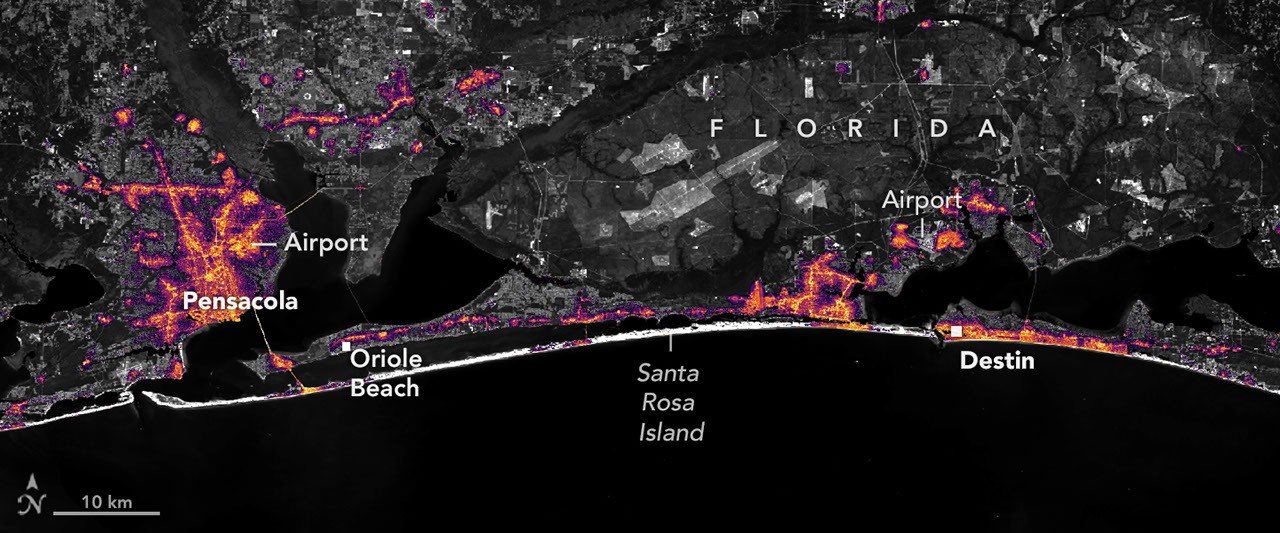
A NASA Earth Observatory report published October 16 shows how satellite-derived nighttime-light maps can reveal storm disruption along Florida’s Panhandle. The images compare an August 2026 baseline with October 11 conditions after Hurricane Isaias, highlighting reduced illumination around Pensacola and toward Destin.
What the maps show
The report identifies NOAA-20’s VIIRS instrument as the nighttime observation source for this example, with a Landsat 9 base map. Cloud-covered gaps are marked separately. The timing matters: these are earlier observations presented in today’s report, not a live view of electricity service.
A subsequent October 12 comparison shows lights returning in some areas. The report says patterns resembled pre-storm conditions by October 14. That is a statement about visible illumination, not proof that every building had power or that all damaged infrastructure had been repaired.
High definition does not mean a meter on every building
The Black Marble HD product documentation contains a crucial qualification: its roughly 30-meter light distribution is modeled by downscaling, not directly measured at that native resolution. The product is intended for visualization rather than quantitative analysis. Counting affected households from individual bright or dark patches would overstate what these images establish.
The same documentation describes monthly, cloud-free composites for pre-event baselines and separate layers identifying cloud obstruction after an event. It also warns that research-grade products may not suit operational decisions on their own and are not guaranteed to arrive on a routine schedule.
A technique with an established history
This is a current application of an existing method, not the invention of nighttime disaster mapping. A NASA Goddard video released in December 2018 describes combining satellite night lights with other geographic data to examine Puerto Rico’s recovery after Hurricane Maria in 2017. It is useful background, but it does not depict this month’s Florida storm.
KNN context: A map can help frame a better question without supplying the whole answer. A dark area might warrant checks against utility reports and local observations; it should not automatically become a numerical outage estimate. The practical advance is a more detailed view for directing attention, with the uncertainty kept visible alongside the picture.